With the spectre of the Positive Train Control mandate looming over small railroads,
it’s not only the short-line railroads impacted.
Long-distance rural lines can have considerable dark territory.
Such railroads may have substantial cost added to their capital budget by PTC.
Without radio contact, such railroads have been limited in dark territory to restricted speed 10-25 mph instead of the 49 mph they might otherwise run in dark territory.
microwave links - much too expensive for distance, terrain vs. low train count
leased (dedicated) phone line - same as microwave–too expensive
PSTN/POTS - use a typical “interconnect” for two-way radio.
The latter option may be much more economically feasible for many rural railroads.
This option has not been evaluated for compliance with federal railroad regulations.
Railroads in the Rocky Mountains, with vast individual tower coverage areas, have long used DTMF selective calling of dispatch to avoid dispatchers being overwhelmed with constant train chatter.
CONOPS of POTS-linked rural dark territory railroad radio: dispatch has multiple phone lines, all ringing for the same number dedicated to inbound radio calls.
Different branches dispatched by distinct dispatchers could obviously have separate phone numbers.
The caller ID of the individual interconnect into dispatch identifies the approximate subdivision the train is on (not for legal purposes but for convenience).
Cell phones could be used in place of POTS if more economical.
Train to dispatch: train keys up mic, dials dispatch phone number like a standard two-way radio interconnect call.
Train engineer uses standard radio message protocol to talk to dispatch, then train hangs up via DTMF.
Can use single frequency for network to keep any other trains advised, although dark territory and long distances imply long blocks.
Dispatch to train: dispatch calls phone number of interconnect they believe train is in range of.
Train engineer answers via DTMF, uses standard radio protocol to talk.
Dispatch hangs up phone, train engineer sends DTMF to close link if phone line hangup not detected.
Besides the typical radio base station tower and antenna, selected with sufficient overlap in 49 mph-desired territory, the Zetron Model 30 is about $600.
Cost of power and phone connection trenching might be mitigated by sharing with cellular towers or power utility company where feasible.
Naturally, a more advanced interconnect could be used to control and monitor railroad switches and the like, also enhancing railway safety.
In regions hauling relatively benign cargo with a single train per day, some in the industry have felt PTC requirements were too stringent.
If it’s not too late, some waivers might be obtained for a time at least by using ideas as above, pending compliance with all applicable regulations.
I tried honestly to use the HP 50g, and here are a few objections that put me back to the TI-89.
The low resolution (blocky/grainy) HP 50g display detracts from its usefulness as a high-end graphing calculator.
Low resolution limits length of equations and number of equations on the screen.
One of the major reasons for having a high-end calculator is to allow entering long equations on the screen.
That being said, the HP 50g has a dedicated core of aficionados.
HP 50g advocates will present a list of counterpoints–and their arguments have merits.
Given the feature set and the inevitable eventual sunsetting of the 15+ year old TI-89 series, a new user considering what high-end calculator to purchase should look to the TI Nspire CX CAS.
In closing, I will give strong admonition to students.
DO NOT rely heavily on calculators in math courses.
This will only cause suffering in later courses.
Even if the last math class in college will be Calculus I or II, you will never gain the true richness of understanding if constantly using a calculator for homework.
A better approach is to do the problems manually, and on occasion check with the calculator.
Legacy auroral video acquisition has been plagued with several problems including
camera sensitivity
data storage
video time synchronization
software instability
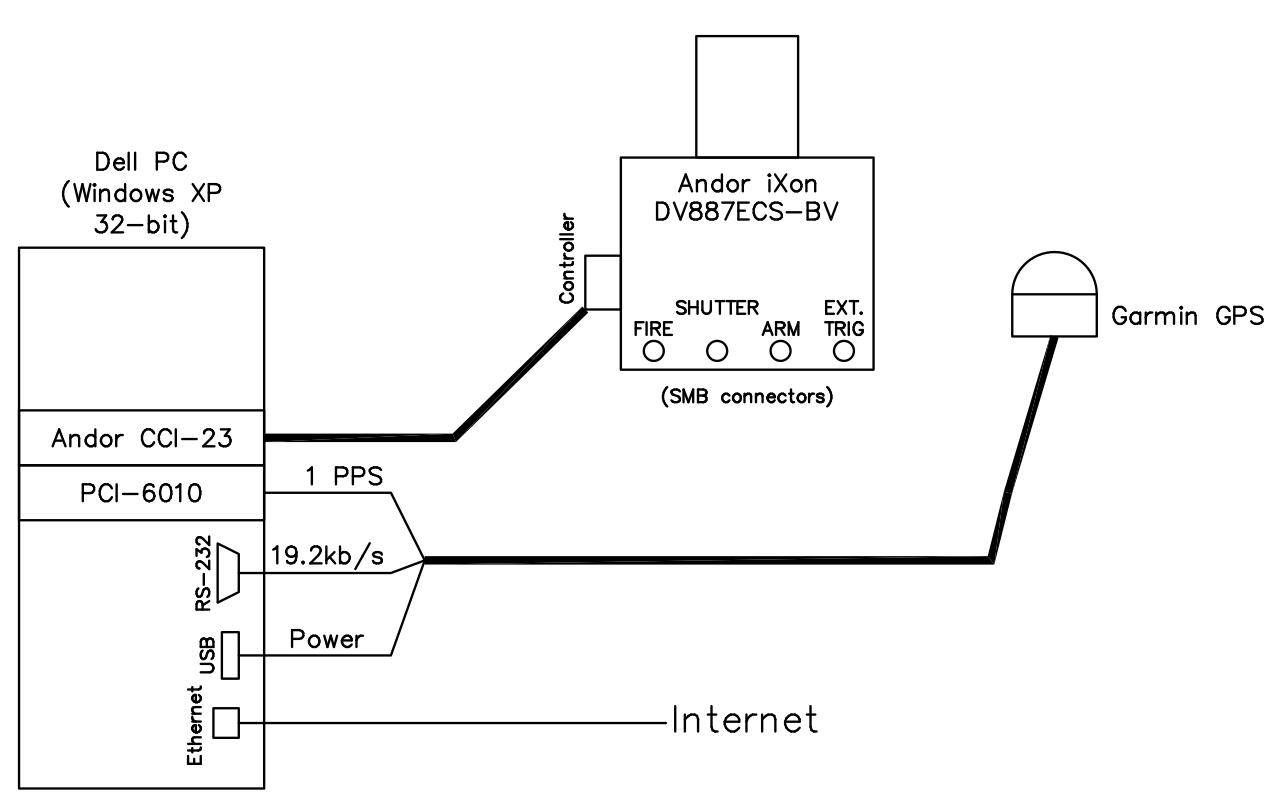
An example of such a system was deployed last winter to Poker Flat Research Range.
The results of this work won “Honorable Mention” at the
CEDAR 2011 Workshop.
A two camera system observed the aurora from Poker Flat Research Range (Chatanika, AK) and Ester, AK.
Notice the hardware synchronization connections on the camera are not being used.
This makes the system reliant on the vagaries of software timing of the OS, which in Windows case can account for order 100 ms.
When one wants 33 ms cadence video, this means such video will be roughly syntonized, but poorly synchronized.
Timing error due to non-hardware synchronization: error for a single frame, the error will accumulate in general due to error bias, quickly leading the cameras to be taking pictures at different times (no video frame overlap in time).
Error source
Description
Error magnitude [s]
camera FPGA
Non-TCXO 100 ppm crystal timebase inside camera
10-6
PC time
NTP error
10-3
software trigger
Start time error due to SDK
10-1
The software trigger error is not predictable and can reach up to 1/2 second.
Aurora has apparent motion of kilometers per second, and so a camera designed for 10..100 m scale width observations needs to have timing error commensurate with the physical phenomenon.
Hopes of a tomographic solution are dashed if the pictures are taken at times distant enough such that the feature of interest changes on timescale less than the error.
imager block diagram
Observational Solution for Auroral Tomography: the ill-conditioned, ill-posed nature of the high-resolution auroral tomography problem dictates attention to detail of all aspects of cross-site registration.
We will have to ensure:
images are accurately registered.
Absolute and relative timing are synchronized to at least 2 orders of magnitude better than the frame cadence (< 1 % timing error)
If the data writing becomes overwhelmed, the system should discard a bit of video and recover rather than stutter the recording.
Plant, G., Semeter, J., Marshall, R., Dahlgren, H., Goenka, C., and Hampton, D. (2011).
A high-speed tomographic imaging system for studying dynamic aurora.
In Instruments or Techniques for Ionospheric or Thermospheric Observation.
CEDAR Workshop, Santa Fe, NM.
ITIT-06.
When you view the aurora, whether by camera or by being outside with your eyes, what you see is a line integral of the line-of-sight brightness of the optically thin aurora.
Mathematically, this is
I = ∫_0 ∞ p(ℓ) dℓ
where:
I is the intensity seen by your eye or camera pixel
p(ℓ) is the volume intensity rate of the aurora at each differential point along ℓ
Volume emission rate of aurora is created when particles (electrons or ions) strike the cold gas of the ionosphere, typically N_2, N_2+ or O.
As altitude increases above a couple hundred kilometers, oxygen starts to become the dominant gas instead of nitrogen.
This affects the color of the aurora, and is part of why aurora appears as green below red.
Unfortunately, many of the images taken of aurora with digital cameras have incorrect white balance, and completely non-physical colors are seen.
Yes, there is purple aurora, but it is quite faint and below the green emissions in altitude.
So a sky full of purple, yellow, and orange is not believable, it’s an artifact of incorrect white balance.
That’s a big part of why it’s good to save auroral photos in RAW format from your camera so you can fix the images in post-processing.